⚠ Switch to EXCALIDRAW VIEW in the MORE OPTIONS menu of this document. ⚠
Text Elements
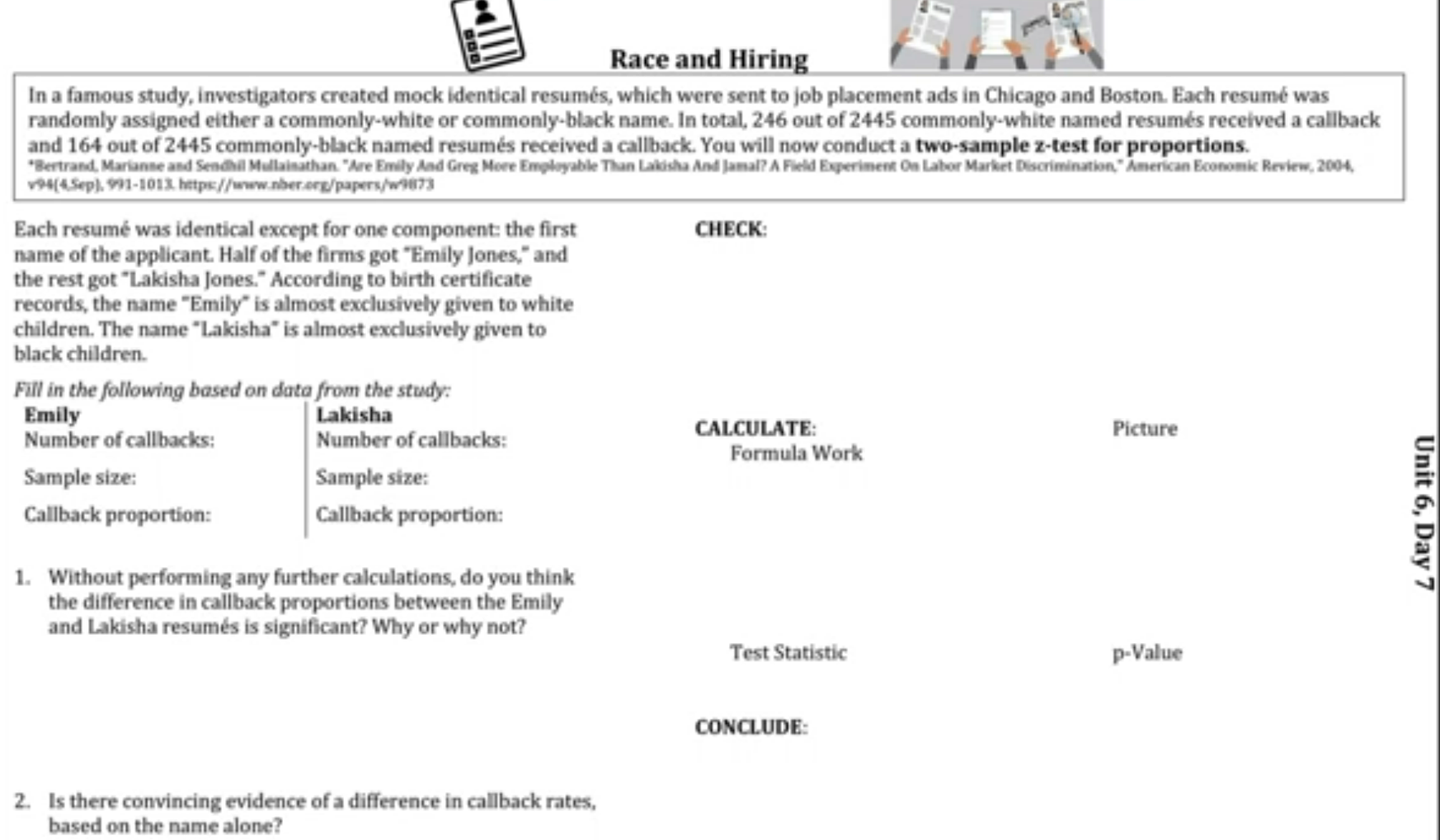
246
2445
0.100613496933
246 / 2445
164
2445
164 / 2445
0.0670756646217
Yes, but mostly because I agree that it is likely to matter for job placement, and not because the data indicates it
yes
Williamson noted that callback rates being low might affect the significance
Always assumed in our level of stats
0
p = p
E
L
p
C
= callbacks from 1
- callbacks from 2
p
C
= 246 + 164 = 410
sample size from 1
- sample size from 2
2445 + 2445 = 4890
410/4890
p
C
=
( for large counts use )
p
C
5%
actual proportion of difference between employability in based on racially connotated names
H
a
p = p
E
L
164/2445 vs 246/2445 accepted calls
the proportion of accepted calls for emily is bigger. For every 10 calls emily gets, Lakisha gets 6.
P - P = 0.34
E
L
E
P
= 0.101 but
P
L
= 0.67
not equal callback proportions.
i basically said this, but worse.
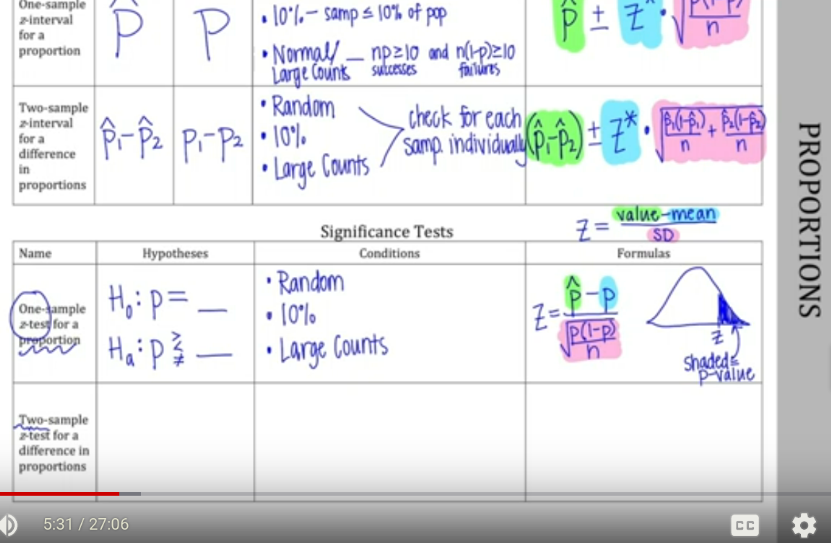
2 sample z test for p1 - p2
E
L
P
P
Random: Doesn’t actually say
10%: 2445 is less than 10% of all jobs
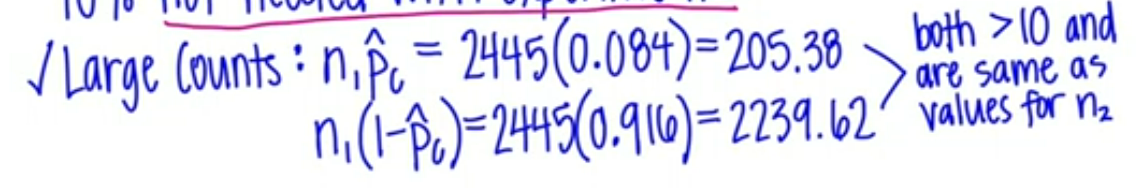
Large counts: we have more than 10 successes ( calls back ) and more than 10 failures ( no call back ) for both
we dont need random sampling if there is random assignment apparently
10% not needed with experiments
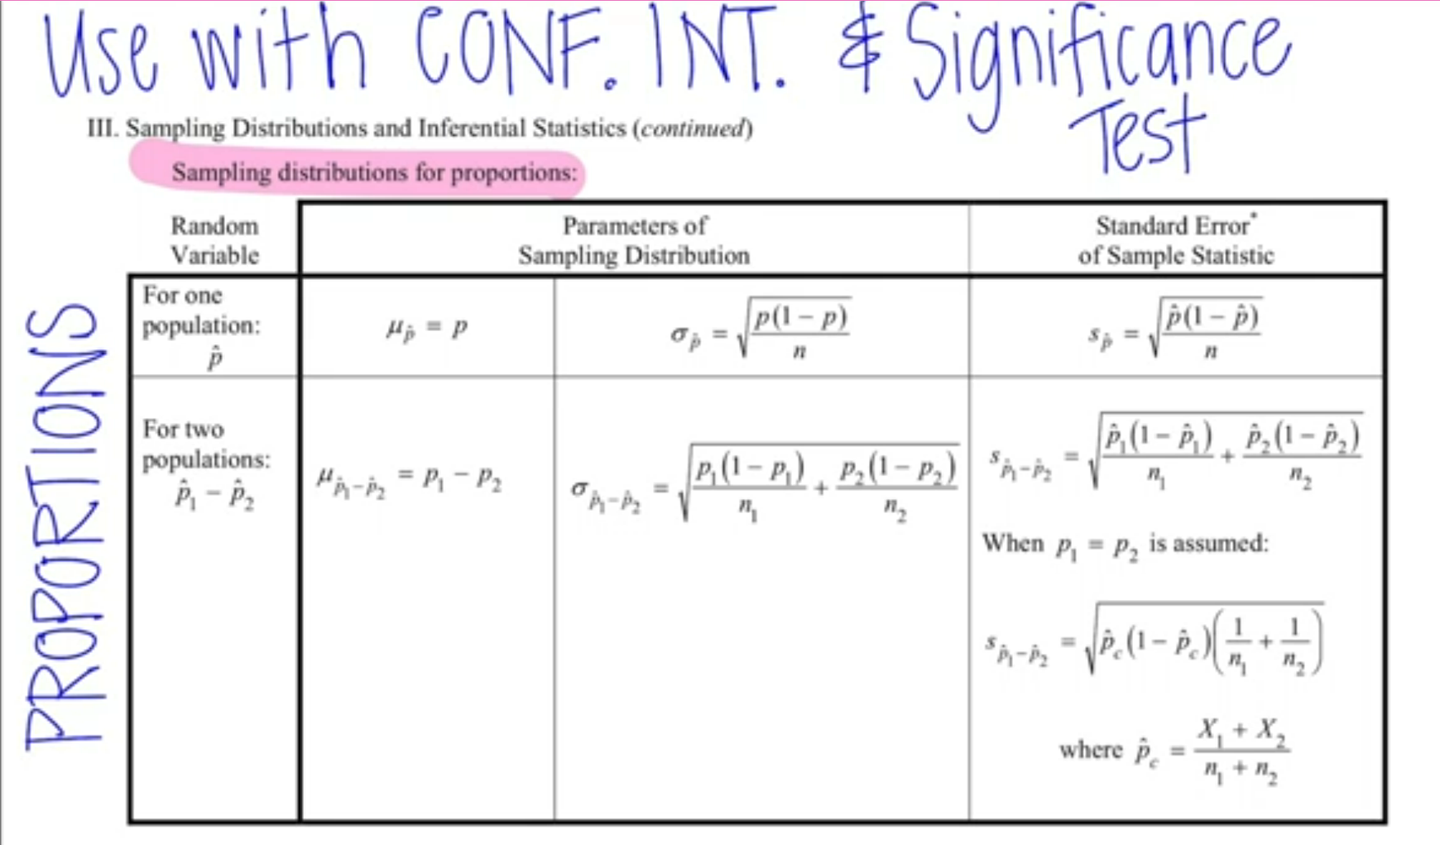
for large counts use phatc instead of individual p1 p2 or pe pl
z = value - mean SD
z = statistic - parameters
standard error
z
=
0.34 - 0
410/4890(1-410/4890) (1/2445 + 1/2445)
=
0.34 .0079
=
4.24
0
4.24
-4.24
difference we expected
difference we saw
4.24
normalcdf(4.24,infinty, mean 0, SD 1)
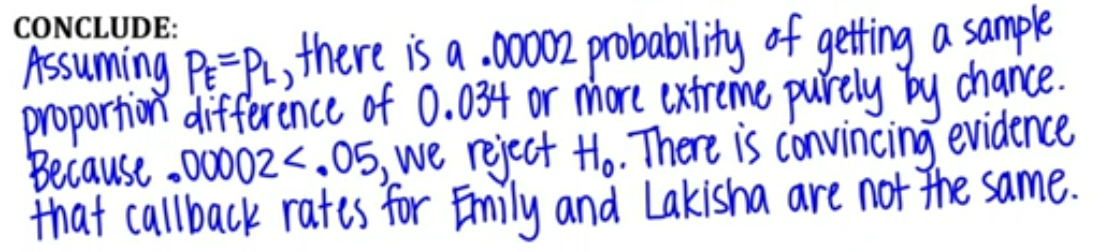
2 * (.00001) = .00002
My conclusion was so wrong i didnt include it
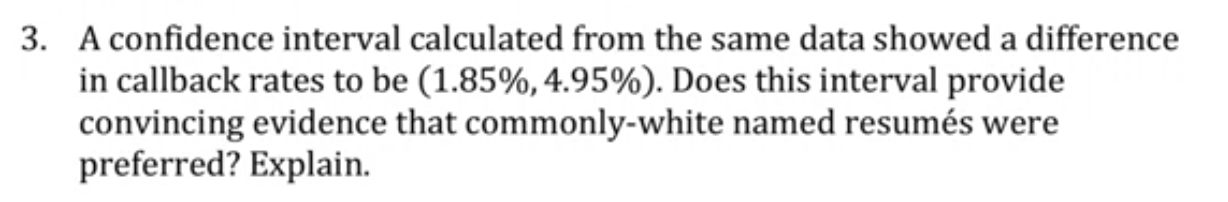
Since 0 is not in the interval, we have convincing evidence that there is a positive difference in callback proportions.
an interval can also have convincing evidence.
Important Ideas
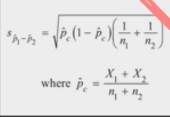
Choose: added 2 sample z test for p1 - p2 as a choice ( our fourth total choice ) h0: p1 = p2 Ha: p1 > or < or = p2 Check and Calculate: use for large counts and for standard deviation / standard error
Conclude : Always include context
P
c
P
c
( which is on the formula sheet)
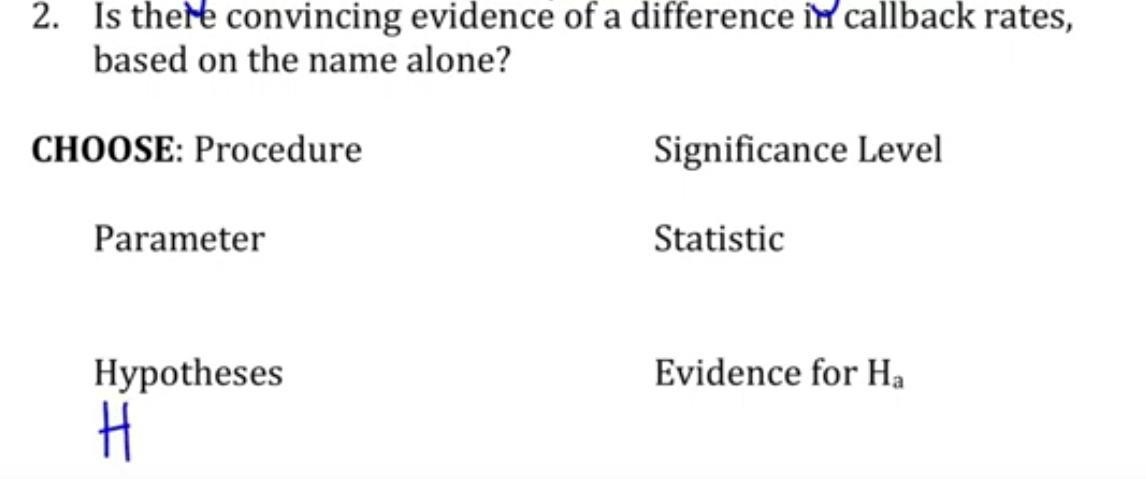
Choose:
Parameter:
Statistic:
Hypotheses:
Procedure:
Evidence for Ha
0.612903225806 ^4gssgnhJ
2 sample z test for p1 - p2
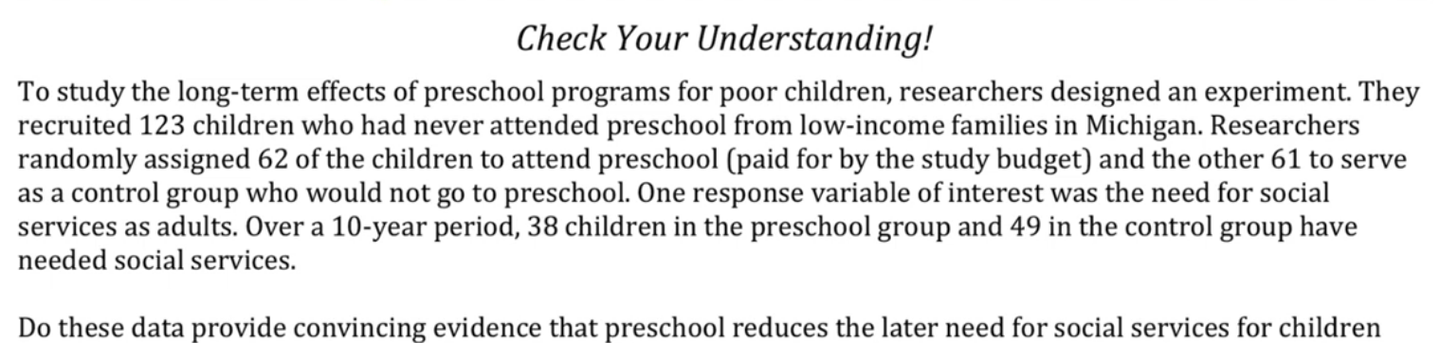
the true difference in proportion of adults who need social services based on whether or not they went to preschool
38/62 Pp
49/61 Pn
H0: Pp = Pn Ha: Pp = Pn
P
p
=
P
n
= 0.803278688525
rounded is
.613
.803
P
p
=
P
n
=
.613 = .803
Check:
Random: “Researchers have randomly assigned”
10%: not needed for experiments
Large counts: 62(.707) = 43.834 62(1-.707) = 18.166 61(.707) = 43.127 61(1-.707) = 17.873
all greater than 10 so large counts is all good
P
c
=
38 + 49
62 + 61
=
123
87
=
.707
Calculate:
z =
statistic - parameters
standard error
z =
.19 - 0
.803 - .613 = .19
.707(1-.707) (1/61 + 1/62)
=
.207 * 0.033
.19
6.273
.19
=
= 0.03
normalcdf(.03, infinity, mean 0, SD 1)
.488
2 * .488 = 0.976
Significance Level: 5%
Conclude:
Assuming Pp == Pn, there is a 0.976 percent chance of winding up with a sample proportion difference of .03 which means we fail to reject h0 as .976 is greater than .05.
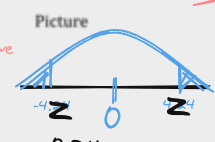
Picture
-.03
.03
0
I have not yet checked the answers and feel like this is wrong
Ha: Pp < Pn
.613 - .803 = -.19
.293
.0821
-2.31
yes it was very wrong, but it was wrong because you did the rest of the problem wrong the conclusion itself, if what it was saying was true, would have been fine.
normalcdf(infinity, -2.31, mean 0, SD 1)
= .01
Because .01 < .05 we reject H0. There is convincing evidence that preschool reduces the need for social services later in life.
H
H
0
a
:
:
p1 = p2
p1 = p2
- Random
- 10%
- Large Counts
use Pc instead of p1 and p2
^
(p1 - p2) - (p1-p2)
^
^
Test is next thursday
10/50 28/53
10/50-28/53 -0.328301886792
Embedded files
8f48d91c23a234105c065f1cf23ec0eb55871734: Pasted Image 20240214143815_615.png 42f334d8962654fbe033a9d02bc7f0ae7e49b135: Pasted Image 20240214144510_821.png 18a637654e7dd4b34ac9c8a4f549642f6d935f68: Pasted Image 20240214144656_827.png 0e2520be1b16ed161b6425fe4166aa21a87300fc: Pasted Image 20240214144824_862.png a56f63f031c4b0ff7b8e67e28735156643a2535b: Pasted Image 20240214150544_280.png 99ee3a9906fc7e9b1b4947da57e80a373bf7e655: Pasted Image 20240214151904_517.png 367433cde405e57f1bf6ca55367115878f8ed973: Pasted Image 20240214155227_860.png ed38a97e74cb37bab533e3cb33ebdedf3700f4a4: Pasted Image 20240214155603_919.png 0fb40e7986ccb176d35f91cd77a49a9308fc0fe2: Pasted Image 20240214160437_154.png 453b6174f11c6ef0dafb5382e75a6aa03163cf3e: Pasted Image 20240215124738_918.png d9804e985bdd100b81e44537ed6360a405b63891: Pasted Image 20240215125326_025.png fa3fb5827674af877bbcdef081fb9eecabb6fe47: Pasted Image 20240215125411_079.png