⚠ Switch to EXCALIDRAW VIEW in the MORE OPTIONS menu of this document. ⚠
Text Elements
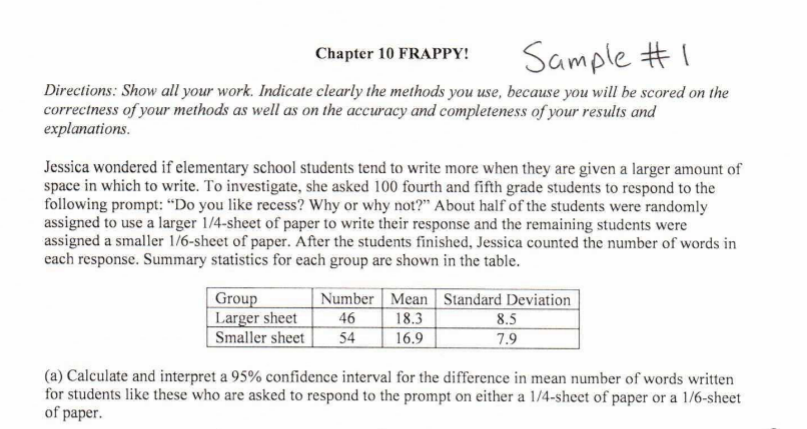
Choose: t interval h0 : mue2 - mue1 = 0 ha : mue2 - mue1 > 0 parameter: mean difference in words written by students when they are given a larger sheet of paper
Check: Random: Yes Normal: sample size greater than 30 so yes
Calculate:
18.3-16.9=1.4
formula for confidence interval: statistic +- (critical value)(standard error of statistic) df = 99, 95% confidence, t = 1.984217 1.4 +- ( 1.984217 ) (
8.5^2
46
7.9^2
54
sqrt(((8.5^2)/46) + ((7.9^2)/54)) 1.6511792497
1.4 +- ( 1.984217 ) ( 1.6511792497 ) 1.4 + ( 1.984217 ) ( 1.6511792497 ) 4.6762979373 1.4 - ( 1.984217 ) ( 1.6511792497 ) -1.8762979373 (-1.8762979373,4.6762979373)
parameter: true mean lifetime of batteries produced in a given hour by neverready. h0: mue = 7 ha: mue < 7
a 5% significance level at a sample size of 4 will lead to a wiiiide confidence interval.
type 1 error: we reject the null hypothesis, and we discard the batteries, even though they were really fine. this is wasting valuable resources and time. type 2 error: we fail to reject the null hypothesis, and batteries which actually do not last 7 hours make it out into the wild, leading to potentially unsatisfied customers.
lowering the significance level to 1% would mean our confidence interval would be a lot wider, our power would be lower, and it would mean we are more likely to make a type 2 error, meaning, we are more likely to give out bad batteries.
type 1: we reject the null hypothesis, and can prove that listening to pandora does increase productivity, even though in reality, it does not. He wastes money on a Pandora One subscription, and it doesn’t actually help productivity. type 2: we fail to reject the null hypothesis, and cannot prove that listening to pandora makes any actual difference, even though it does make a difference. He misses out on the performance gains associated with listening to pandora.
h0: mue1 = mue2 ha: mue1 > mue2 parameter: true difference in mean length between fish with and without karimones procedure: 2 sample t test check: “assume the conditions for inference have been met” calculate: x1 : 37.26 Sx1 = 4.68 n1 = 214 x2 = 30.67 Sx2 = 4.19 n2 = 152 t: 14.1191 p: 2.4E-36 2.4E-36 < 0.05, so we reject h0, we do have convincing evidence that in the presence of fish kairomones mean tail spine length increases.
how were the water fleas sampled ? was it random? how many water fleas are there worldwide with and without kairomones? could this be more than 10% of all those fish? ^
we need atleast a sample size of 30 to assume its normal
because .5 is not in the interval, we do have convincing evidence that there is a difference between male and female birthrate.
how close we are to .5. the bottom of our interval is just .5028. A test would just say “they are different”, where this interval shows us that though the difference is statistically significant, it may not be practically significant.
no need to say all that, just say it provides a range of possible values instead of just pass fail.
choose: h0: mue1 = mue2 hA: mue1 > mue2 parameter: whether or not cardiopump is more effective than CPR for saving people from heart attacks. procedure: 2 sample z test for difference in proportions Check: Random : yes - they flipped a coin to determine initial treatment, and used whether it was an odd or even day to alternate treatments. 10%: good - this is less than 10% of all heart attack victims normal: good - this is more than 30 people on both. Calculate:
choose:
Embedded files
1eb3f2c62c2c20659d97dea8f4e13a50a38f17ee: Pasted Image 20240314232741_100.png 8a25e49d5514611ea96699e6d75beba8ebf9aa28: page=1 0638fb36243750ed5b653e245361bf83af468672: page=2 6bc5504db71eb599973af0b838adea640eafef6e: page=3 fae3a3bab553474bfd5a32bbc3dc08a78a026432: page=4