⚠ Switch to EXCALIDRAW VIEW in the MORE OPTIONS menu of this document. ⚠
Text Elements
16 6.125 1.668 3 5 6 7 9
n mean SD min q1 med q3 max
xhat = 7.3 Sx = 1.494 n = 10 h0 : Ms = Mc ha : Ms != Mc
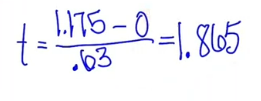
sig level : 0.05 statistic : xhat1 - xhat2 = 7.3 - 6.125 = 1.175 2 sample t test for difference in means parameter: the true difference in mean amoun of sleep between ap stats students and ap calc students
Check: random good 10% 10 students are less than 10% of all ap stats students 10% 16 students are less than 10% of all ap calc sutdents normal : no strong skew or outliers
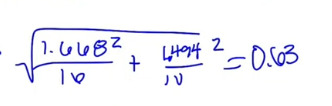
SE m1 - m2 =
Embedded files
1534facf2b9ef856a244f08b5fae9b0f324734a3: Pasted Image 20240307134301_659.png e52f073981cb0e66147bf8478511c0fc5164da12: Pasted Image 20240307134316_660.png 22b2d457056f72c331696d7c2755cbce1d9b7373: Pasted Image 20240307134316_665.png b0960bd24c7001fb0c514a7abb0e6ec0b52a043e: Pasted Image 20240307134331_660.png