⚠ Switch to EXCALIDRAW VIEW in the MORE OPTIONS menu of this document. ⚠
Text Elements
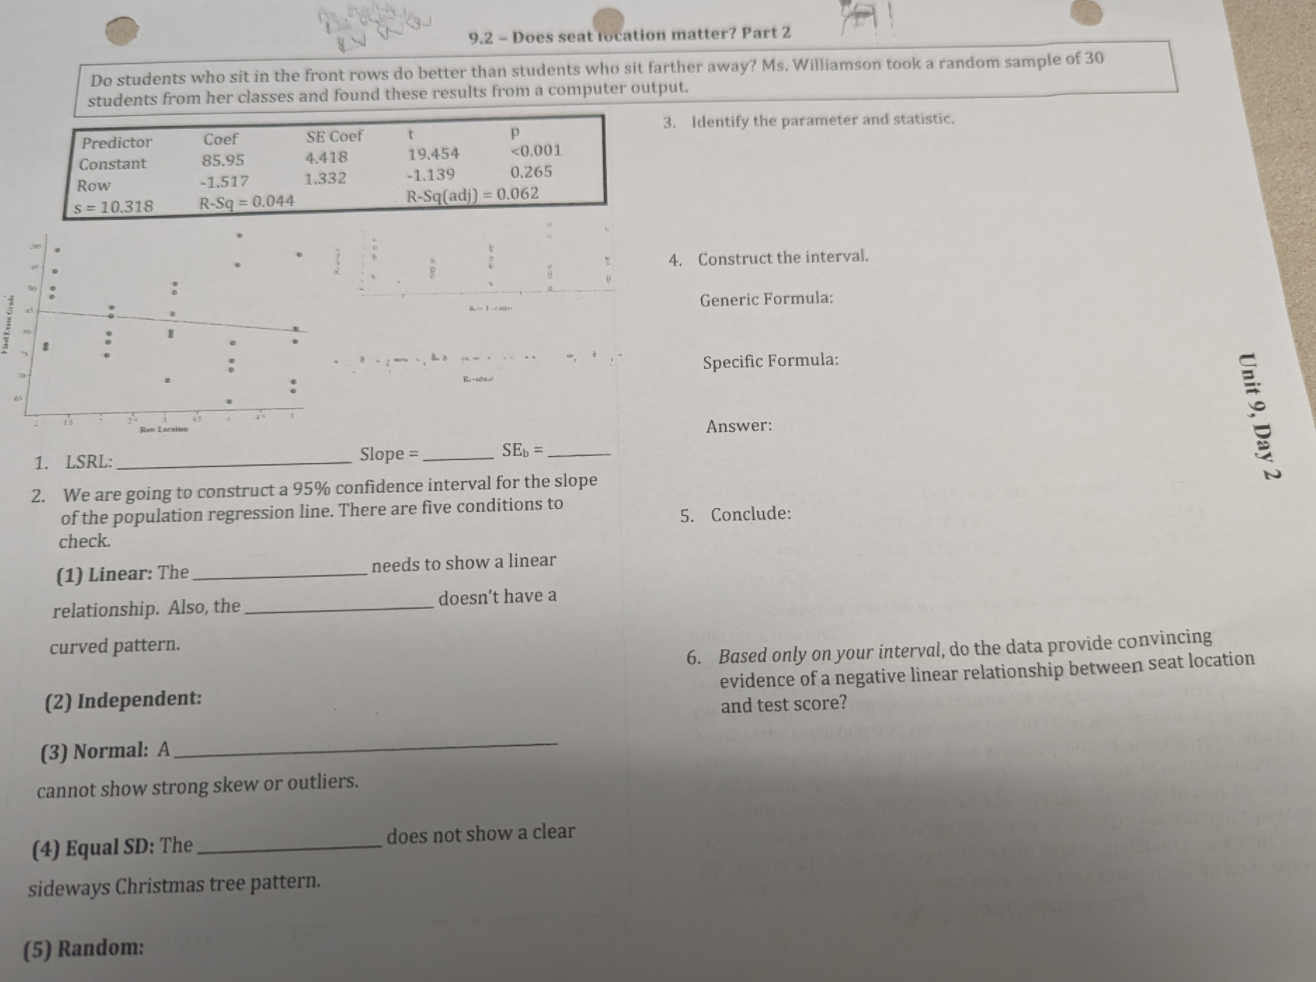
yhat=85.95-1.517x
-1.517
1.332
a
SEa
b
a
b
SEb
p value
test statistic
scatterplot
residual plot
dotplot of residuals
scatterplot
residual plot
each seat & score is indep. of others
dotplot of residuals
samples are randomly selected or assigned
residual plot
LINEAR
and
slope: -1.517
beta ( true slope of pop )
statistic +- (critical value)(standard error)
-1.517+(-1.96)(1.332) -1.517-(-1.96)(1.332)
(-4.13,1.09)
we can be 95% confident that the value of average ____ falls between -3.034148 and 0.00
No, as the interval includes 0.
Interval
Test
Choose:
parameter = beta = true slope of population lsrl
h0, Ha
Check:
L I N E a R
inear
ndependent
qual SD
ormal
andom
Calculate:
b+-t*SEb
t=b-beta
SEb
p-value
Conclude
We are 95% confident
Because p ><alpha we reject / not reject
computer output
- SEb is given
- t is given ( only for significance tests, its not t*, which is what we need for confidence intervals )
- p value is given ONLY FOR Ha: != (if Ha is <> halve it
Embedded files
c60c34107f6191737b17689f77c413717abd8bbc: Pasted Image 20240410125345_519.png 7538695ff136d547837eeec11bada8ef1bef5508: Pasted Image 20240410135534_299.png