⚠ Switch to EXCALIDRAW VIEW in the MORE OPTIONS menu of this document. ⚠
Text Elements
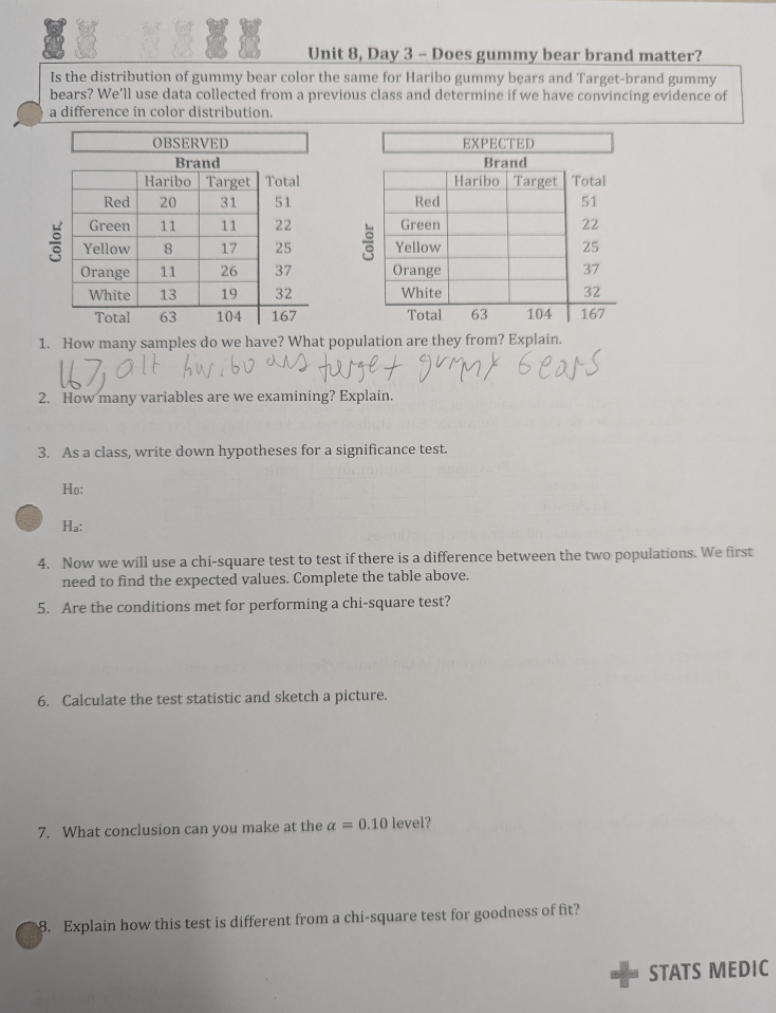
2
1, color ( 5 categories )
Xbar1 == Xbar2 The color distribution is the same for haribo and target gummy bears Xbar1 != Xbar2 The color distribution is not the same
19.2
8.3
9.42
13.9
12
19.9
23
15.58
13.7
31.7
same every time
random: good
63 ⇐ 10% and 104 ⇐ 10% of all target
large counts : expected values all more than 5
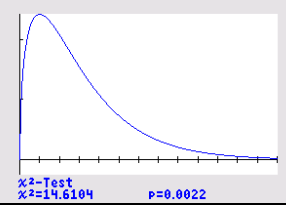
x^2 = 2.8748 p value = 0.579
x2(4)
.579
2.87
0
reject the null because .579 > .10 there is not convincing evidence of unequal color distribution
2 samples instead of 1
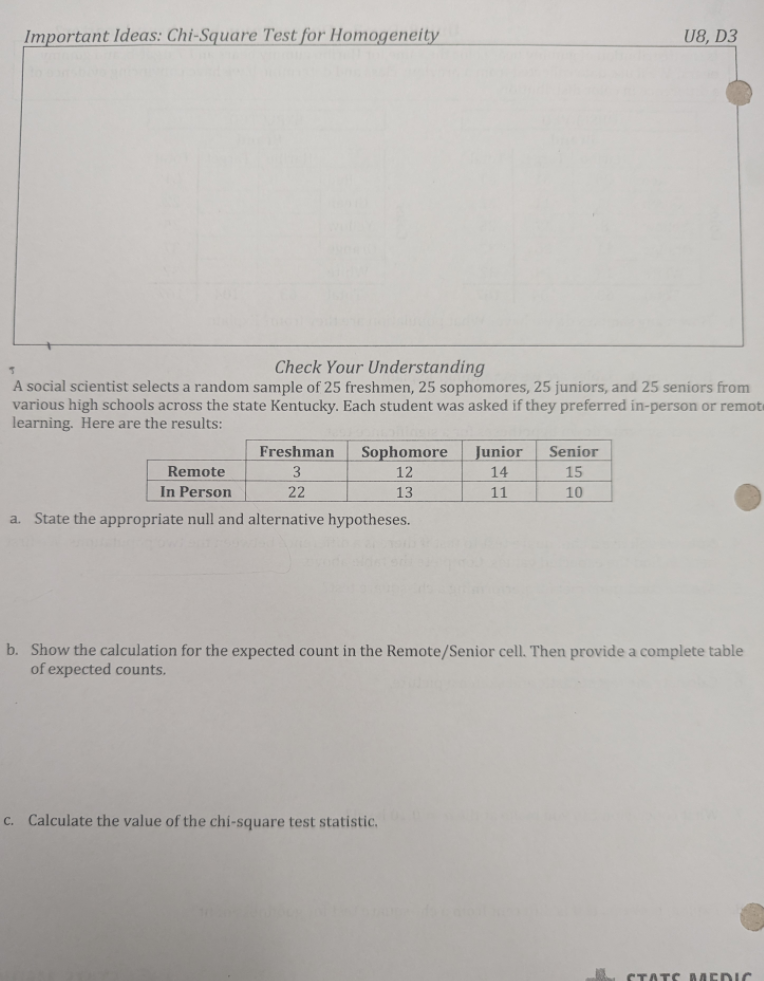
X^2 test for homogeneity
Hypotheses | H0 : the distr of… is the same between … Ha: the distr. is not the same
Calculator: Observed in matrix stat - tests - x^2 test not goodness of fit
GOF vs Homogeneity: GOF - 1 sample, 1 variable - multi category HOMO - 2 samples, 1 variable - multi category
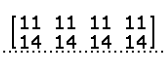
H0: the distribution of people who prefer remote or inperson learning is the same across the different grades Ha: distribution is not the same
Embedded files
49c96ee9eef78187d8c14f2a897d63f297f93f12: Pasted Image 20240325121925_051.png e16656be7c2d75e0c933d75d20237539c5e6a3fb: Pasted Image 20240325130848_626.png 7ede664531248959f24224f5ccb8a79d8855678b: Pasted Image 20240325132203_680.png 5fa1bf1c6c04e4888693fc1658b02e1ce7a72fb0: Pasted Image 20240325132218_699.png