⚠ Switch to EXCALIDRAW VIEW in the MORE OPTIONS menu of this document. ⚠
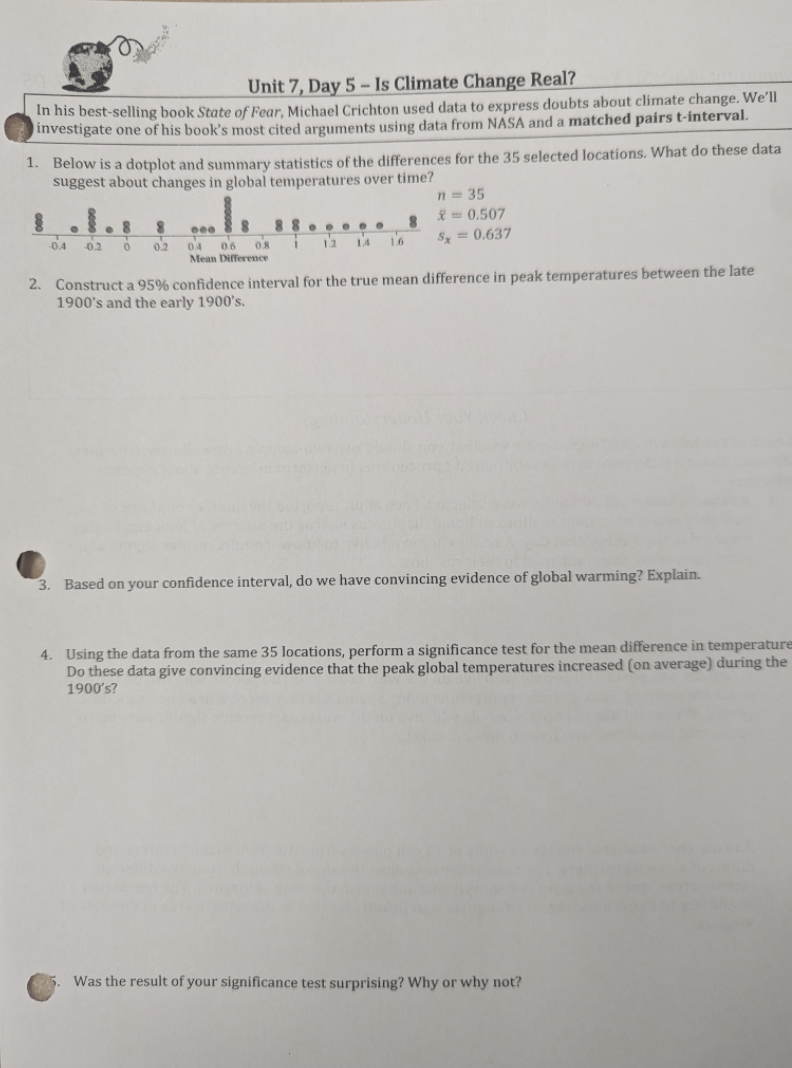
Text Elements
temperature is usually going up
Choose: matched pairs t interval. parameter: difference in mean temps between the early 1900s and late 1900s
check: random good normal good 10% good calc: t interval stats (xbar = .507, Sx = .637, n=35, C level = .95 ) = 0.28818, 0.72582 t = 2.042. .807 +- 2.042(0.637/srqt(35) (.287, .727)
we are 95% confident that the interval from .287 and .727 captures the difference between temps in the early and late 1900s
Choose: matched pairs t test same as above h0 : m = 0 ha : m > 0 sig level = 0.05 check: conditions were already met calc: t=4.7 ( picture ) p = 0.00002 conclude: because 0.00002 < 0.05 , we reject h0. Ther is convincing evidence of an increase in global temps from early to late 1090s
1 diff in temperatures
yes because every value in the confidence interval is greater than 0 which means we have evidence for global warming
no, because we had already said that we agreed that there was global warming
Paired Data
2 Samp Data
vs
vs
-
findind mean difference
-
subtract data pairs THEN find mean
-
treat it as 1 sample
-
finding a difference of means
-
find mean and THEN subtract data pairs
-
treat as 2 samples
paired one sample of adults comparing email vs mail
2 sample indep. 100 west 100 east
paired - one sample of 15 phones comparing VA vs PA
Embedded files
2b2616b2f7b0bdffa764a3b16dc9a231edd87118: Pasted Image 20240311125335_443.png 8511844f30f4f9234452c61e1683219fdfd5caa4: Pasted Image 20240311125343_312.png