⚠ Switch to EXCALIDRAW VIEW in the MORE OPTIONS menu of this document. ⚠
Text Elements
Name
Statistic
Parameter
one sample t interval for a mean OR paired t int
X
μ
- Random
- 10%
- Normal - pop is norm - CLT : n >= 30 - no strong skew / outliers
Conditions
Formulas
statistic +- critical value * stnd error
Confidence Intervals
X
t* *
s
—
sqrt(n)
df = n-1
Two sample t interval for a difference in means
17.67
4.90
14
3.6
n2=6
n1=6
3.67
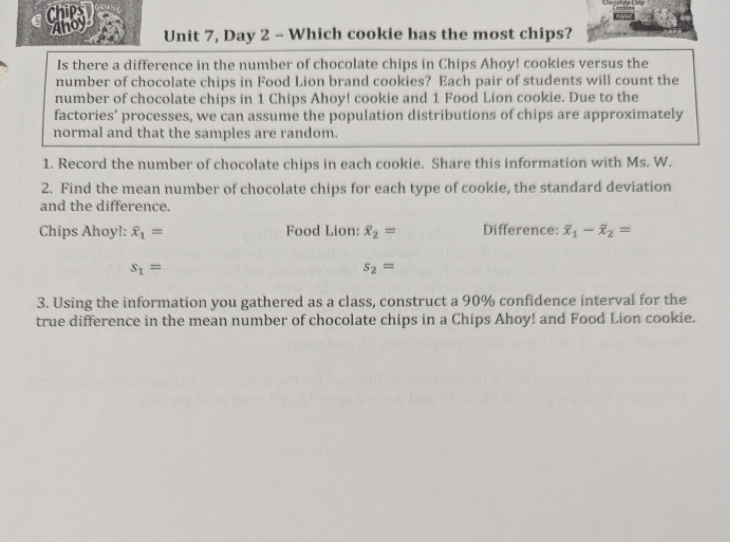
Choose population: all chips ahoy and food lion cookies parameter: true difference of average number of chocolate chips between chips ahoy and food lion cookies statistic: 17.67 and 14 sample : 6 cookies of each 2 sample t interval for a difference in means Check 10% - good, we did not sample more than 10% of all cookies. large counts - normal random - good Calculate t* = 2.015 s1^2 + s2^2 4.90^2 + 3.6^2 24.01 + 12.96 ---- ----- -------- ---- ------- ------ 4 + 2.16 = 6.16 2.4819347292 n1 n2 6 6 6 6 xbar +- t* * 2.48 3.67 +- ( 2.015 * 2.48 ) 3.67 + ( 2.015 * 2.48 ) = 8.6672 -1.3272 -1.3272, 8.6672 Conclude the difference between the mean number of chocolate chips in chips ahoy and food lion cookies is not significant because 0 is in the interval.
yes there is evidence but it is not convincing because 0 is in the interval, which means it is entirely possible there is no difference.
- 2 sample t interval for a difference in means
- conditions — check for samples separately
- df = smaller n - 1
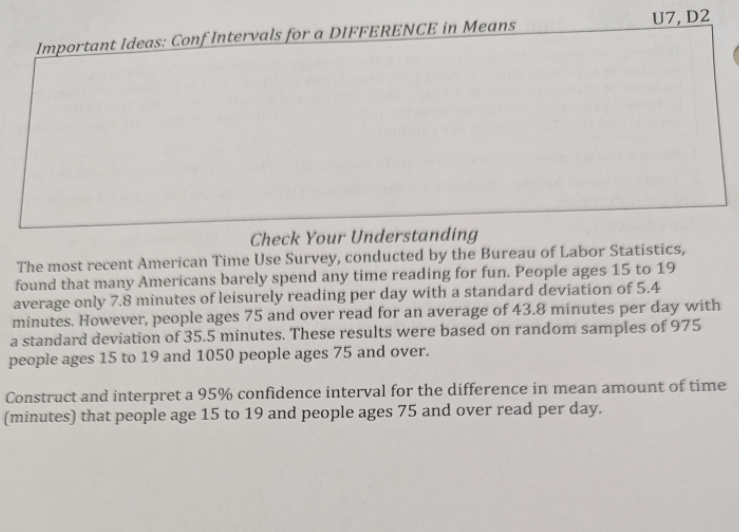
Check x1 7.8 s1 5.4 x2 43.8 s2 35.5 n1 = 975 n2 = 1050 2 sample t interval m1 - m2 = true difference in mean time spent reading x1 = x2 = 7.8 - 43.8 = -36 95% confidence level
check random - independant random samples 10% : 975 < 1/10 ( all ages ) 1050 < 1/10 ( all age 75+ ) normal : 975 > 30, 1050 > 30
calculate 2 samp t interval in stat - > test (-38.176, -33.824 ) conclude: we are 95% confident that the interval from -38.176 , -38.824 captures the true difference in mean time spent reading ( ages 15 to 19 - ages 75+ )
μ1 - μ2
X1
X2
- Random
- 10%
- Normal - pop is norm - CLT : n >= 30 - no strong skew / outliers
X
t* *
df = n-1 remember to use the smaller n
s1^2 s2^2 ---- + ----- n1 n2
check each sample seperately
Name
Statistic
Parameter
one sample t interval for a mean OR paired t int
X
μ
- Random
- 10%
- Normal - pop is norm - CLT : n >= 30 - no strong skew / outliers
Conditions
Formulas
X
t* *
s
—
sqrt(n)
df = n-1
Two sample t interval for a difference in means
μ1 - μ2
X1
X2
- Random
- 10%
- Normal - pop is norm - CLT : n >= 30 - no strong skew / outliers
X
t* *
df = n-1 remember to use the smaller n
s1^2 s2^2 ---- + ----- n1 n2
check each sample seperately
Embedded files
81be93799e253e844eaedba44d6ce38299871772: Pasted Image 20240228125951_053.png c654ea02adbda34727e32dddc70600d311a32909: Pasted Image 20240228132310_452.png 93494c7a52dc9058880d3d1f6095a86d7c091e81: Pasted Image 20240228134846_706.png