⚠ Switch to EXCALIDRAW VIEW in the MORE OPTIONS menu of this document. ⚠
Text Elements
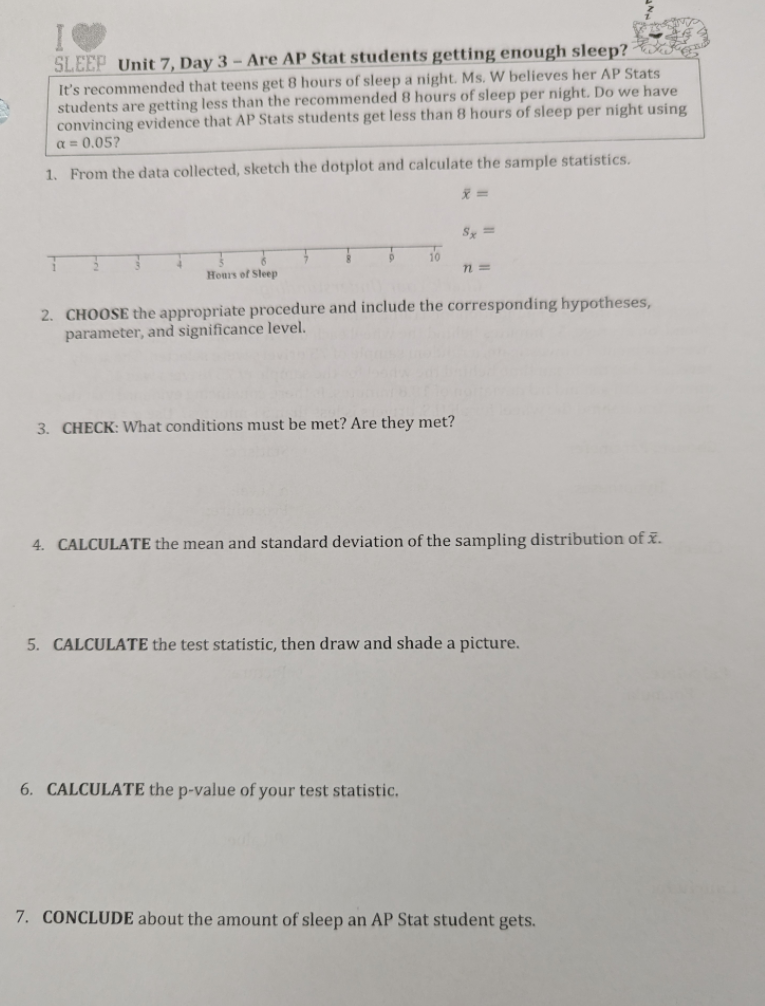
1 sample t test for means h0 : M = 8 ha : M < 8
Random : Yes, we used a spinner 10% : 10 is less than 10% of all ap stats students normal : we do not have any outliers and it isnt skewed
6.35
1.492
10
mean: 8
statistic - parameter
standard error
6.35 - 8
1.492/sqrt(10)
-1.65/1.42/sqrt(10) = -3.497
normalcdf(-99999, -3.497) = 0.002
sqrt(1.492/sqrt(10))
0.68688559957
We reject the null hypothesis, we have convincing evidence that Mrs. W’s AP Stats students, on average, get less than 8 hours of sleep because p<.5
M= parameter = mean hrs of sleep AP Stats students get
significance level = 0.05
always assume mean is null hypothesis
error
-3.5
N(0,1)
t(9)
tcdf(-99999, -3.497) = 0.0033
Choose - 1 samp t test for m h0: m = ___ & define parameter ha: m ><!= ___ Check: Random ( to generalize ) 10% ( to use standard deviation formula ) Normal ( to show shape )
Calculate t = stat - param ---------------- standard err
t
t(df)
p-value - tdf in calculator
Conclude p⇐ alpha : we reject h0 p > alpha : we accept h0
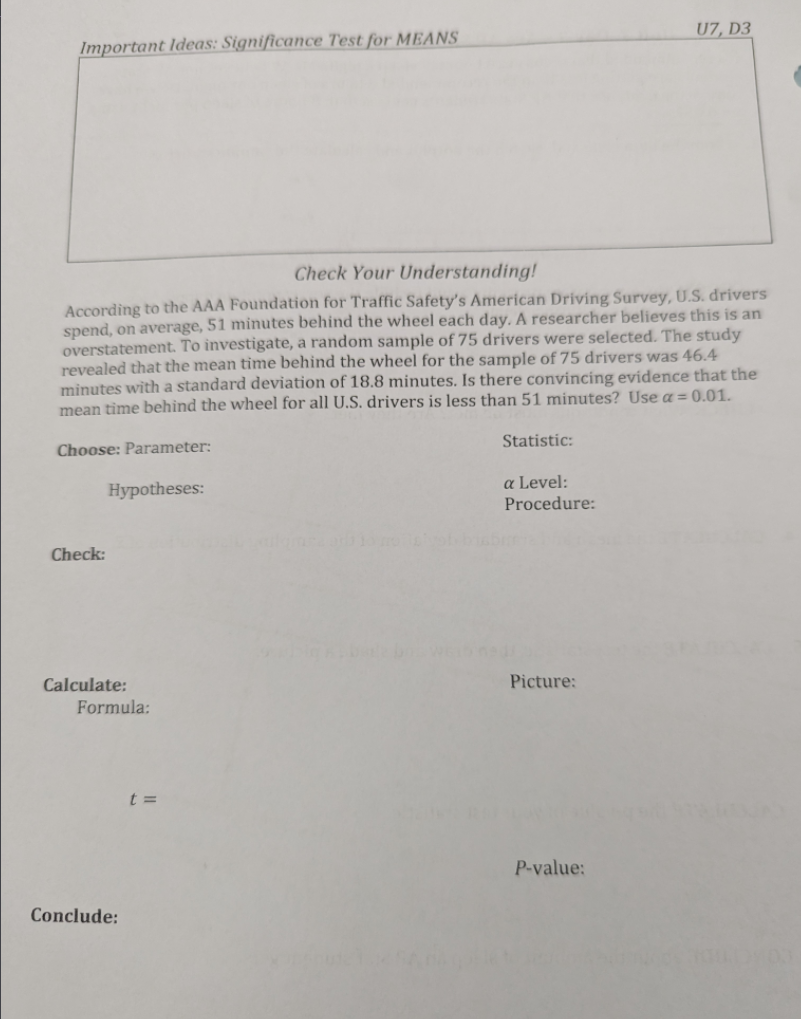
M = mean drive time for all US drivers h0: M = 51 ha: M < 51
xbar = 46.4
0.01
one sample z test for M
Random: met “random sample of 75” 10%: met 75 < .10 ( all us drivers ) normal: met 75 > 30
t = xbar - M s/ sqrt(n)
-2.12
-2.12
0
t(74)
0.0187
Embedded files
b48e0d64017fb901d37590e3f8f446f148e839cc: Pasted Image 20240301125757_780.png 1824ec7c670b41926ccbcbba2edab46e19748594: Pasted Image 20240301125757_842.png